Figures
Every figure below is produced by the scripts in scripts/ from the frozen
evaluation manifests; none is hand-drawn. Rates come from
the technical report, which measures them at n=3000.
Training
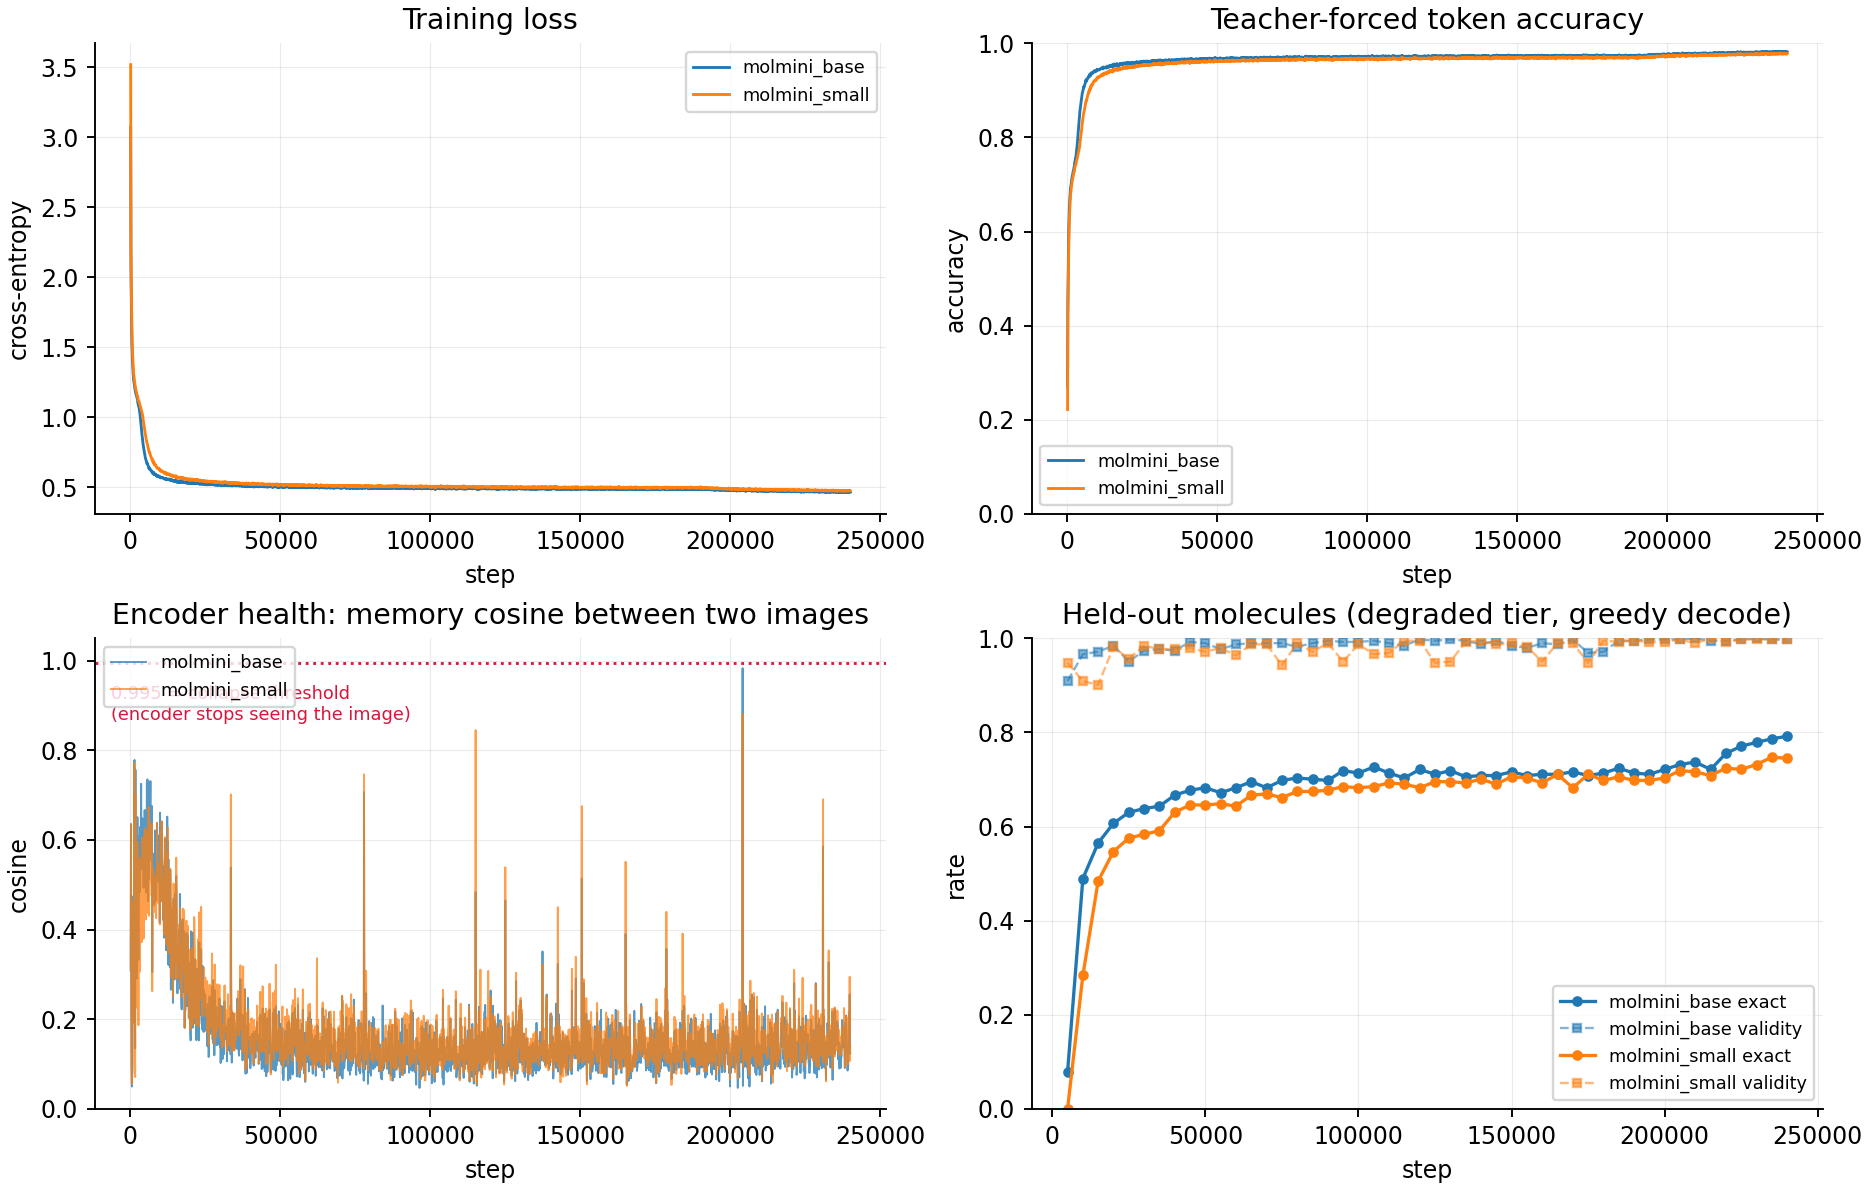
Both runs to step 240,000: training loss, teacher-forced token accuracy, encoder memory cosine between two images, and held-out validity and exact match under greedy decoding.
What the model is shown
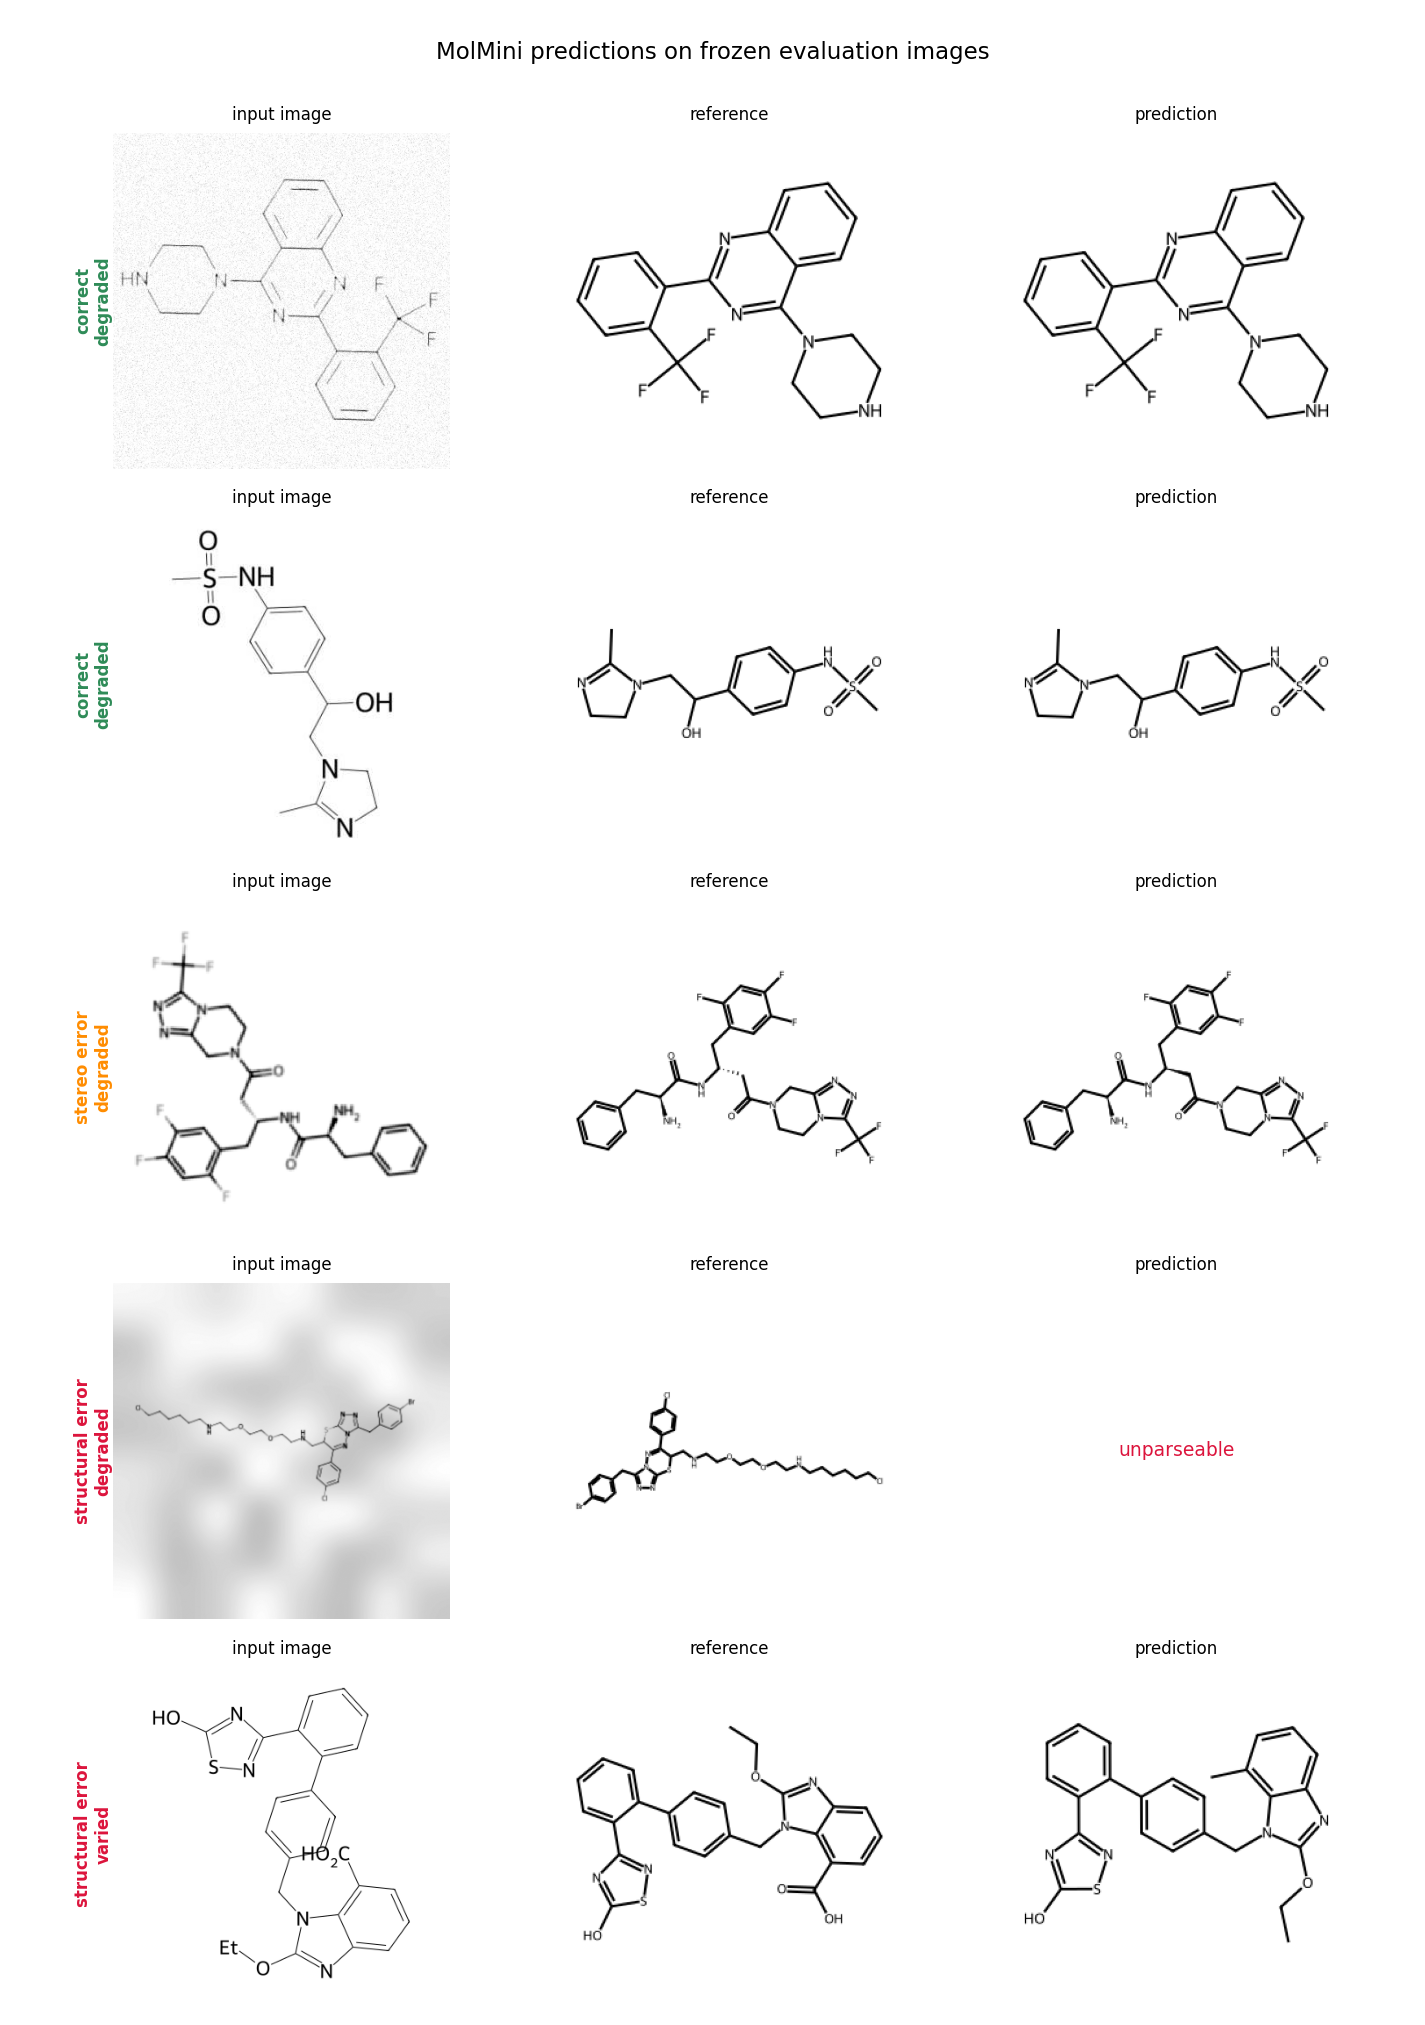
Evaluation images across the clean, varied and degraded tiers.
MolMini base (23.8 M)
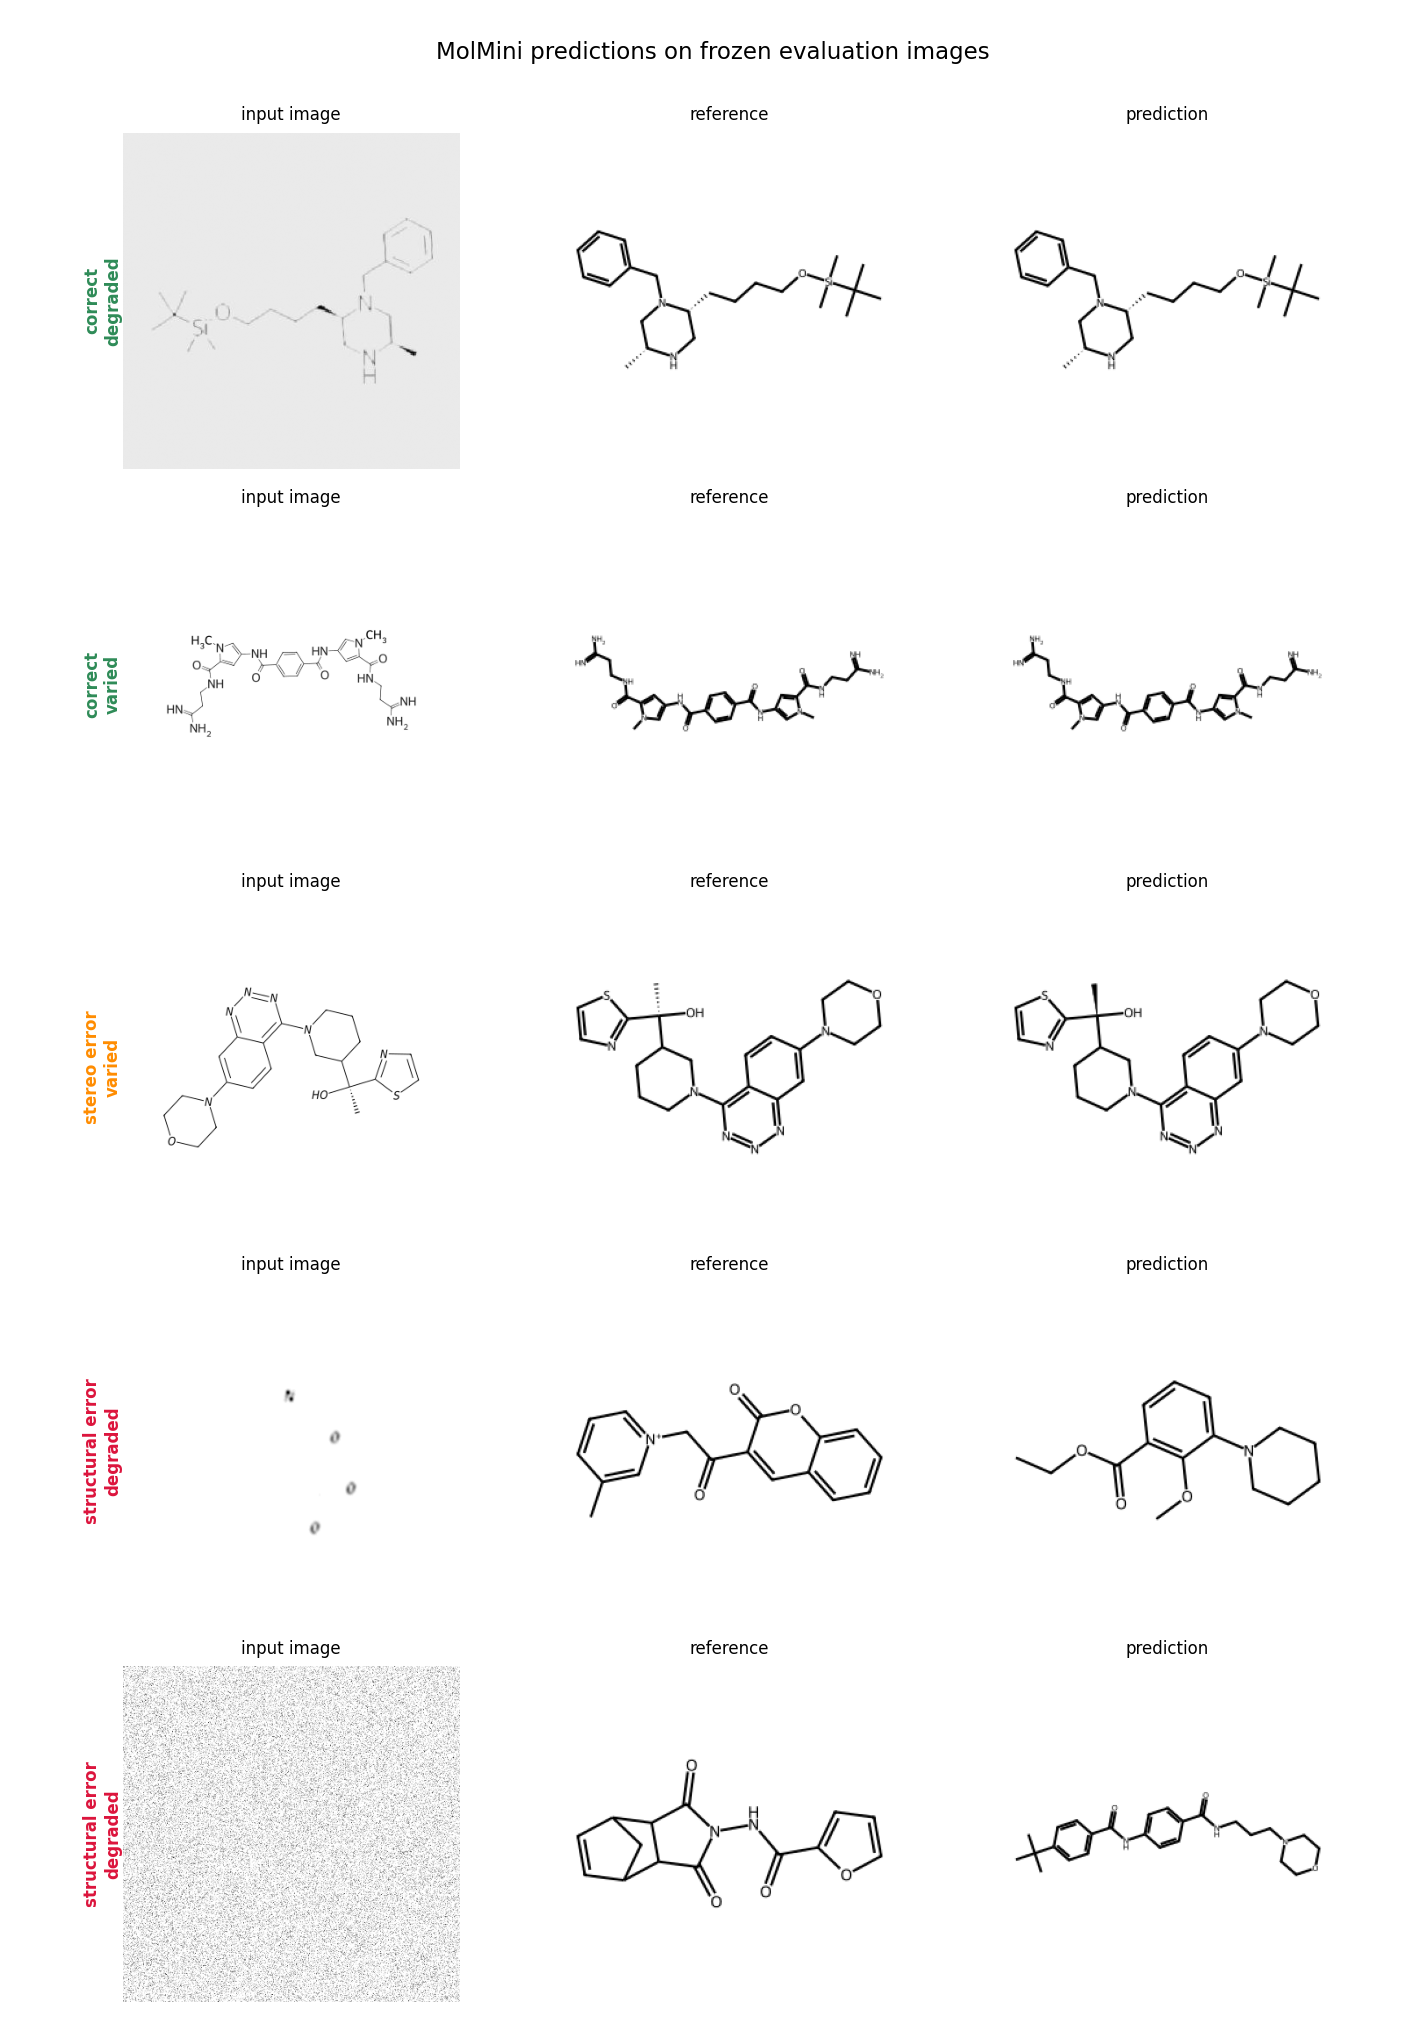
Predictions beside references on chembl_test_linux.
MolMini small (12.1 M)
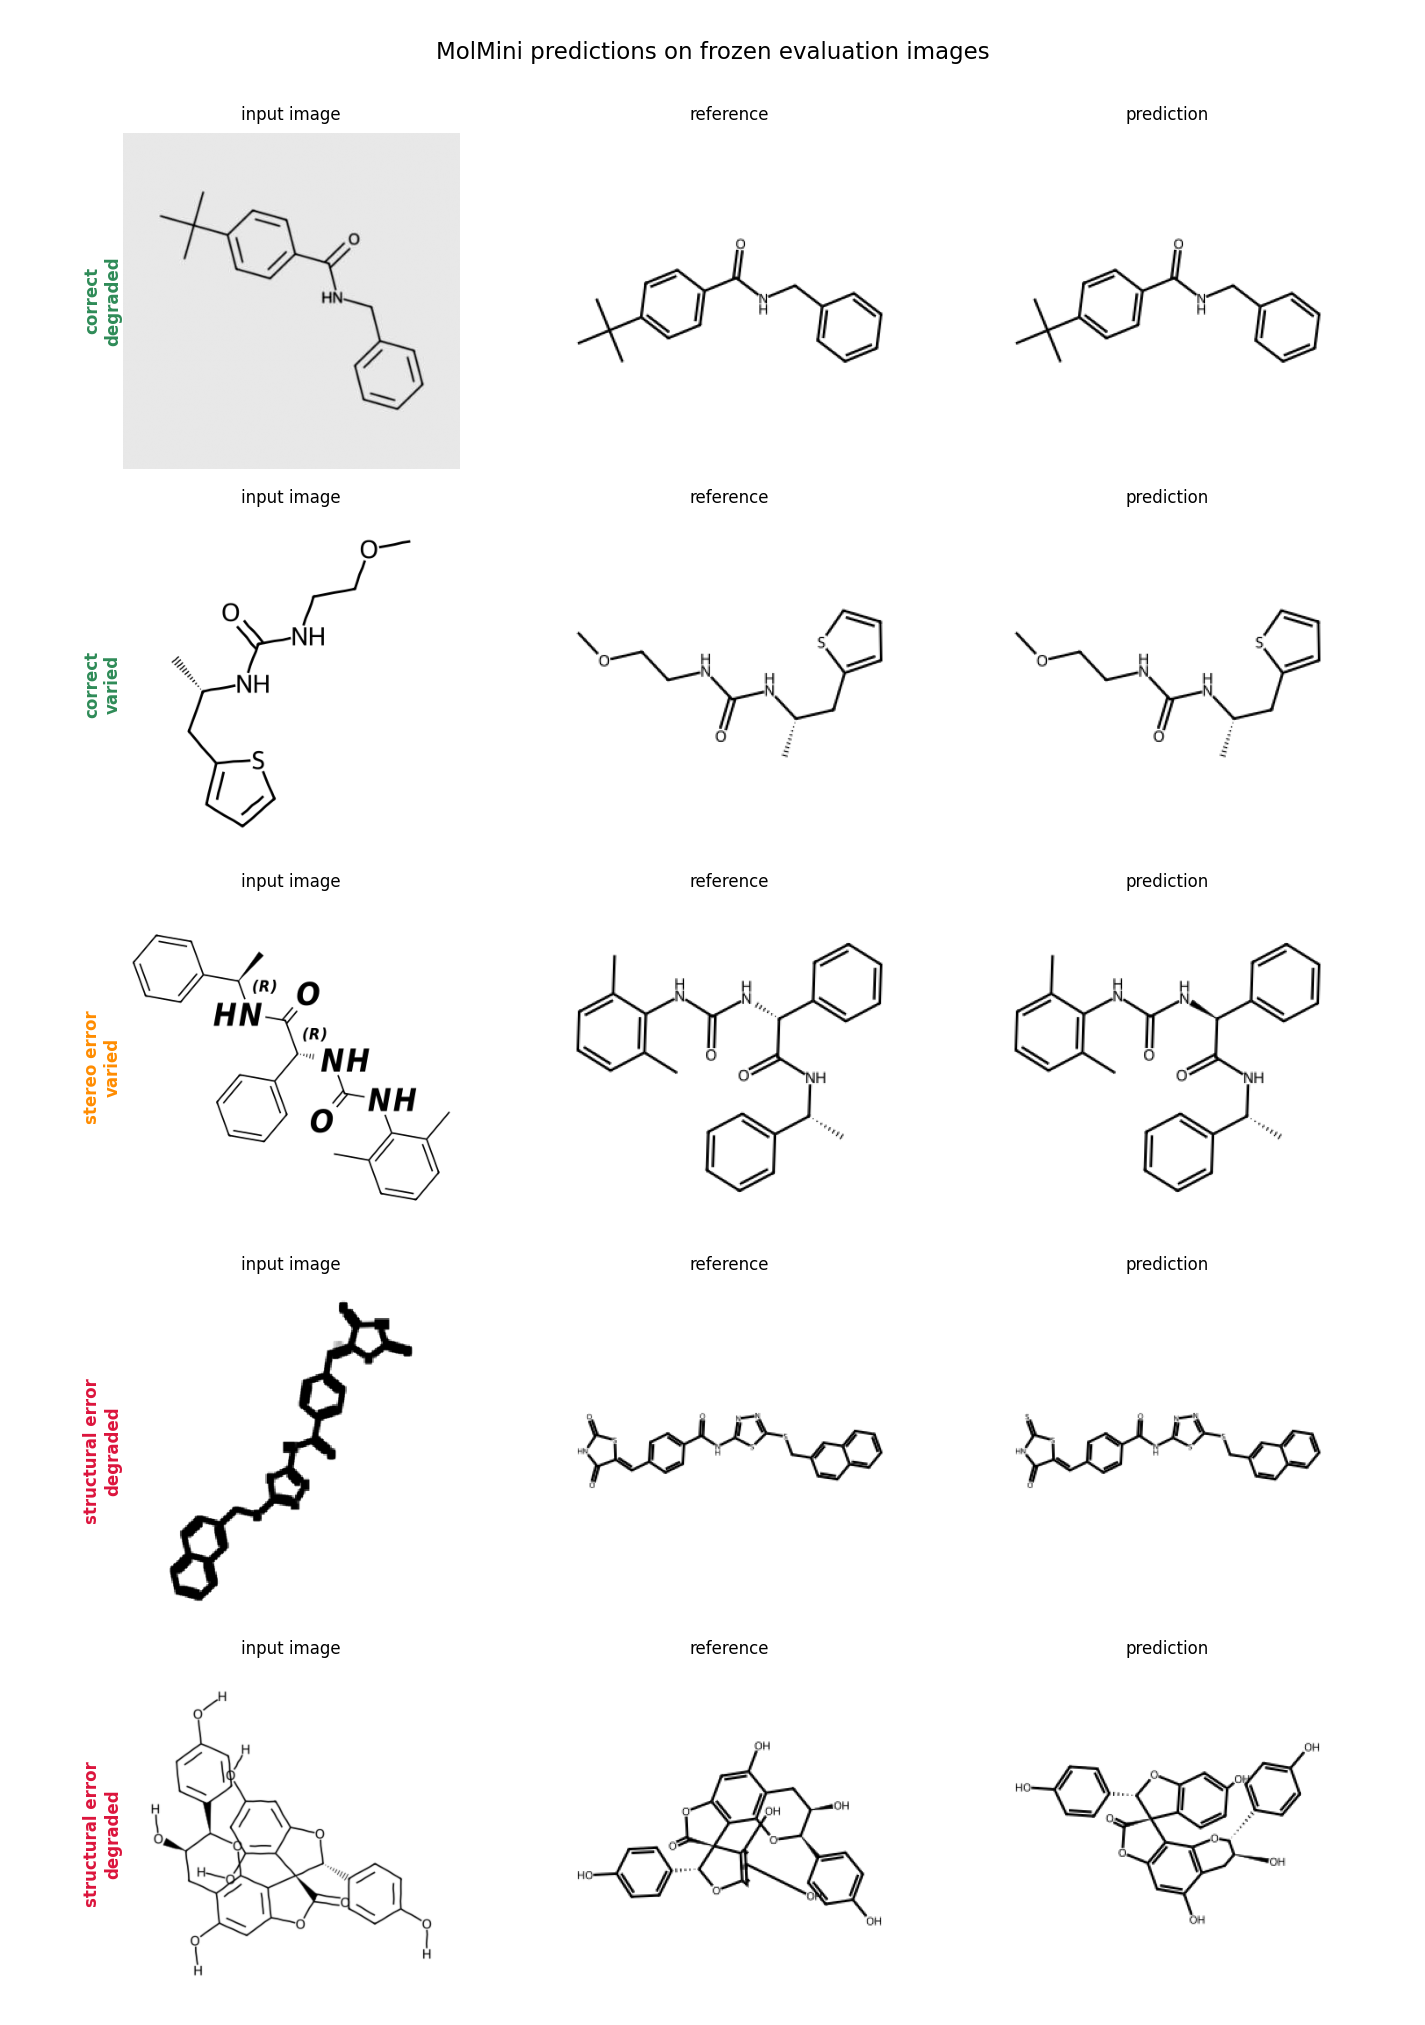
The same images, decoded by the smaller model.